Hugeasscity Has Sold Out To THE MAN

It’s old news by now, but for those of you outside the Seattle hipster-wonk-politico bubble, let it be known: hugeasscity has found a new home on Publicola. Content will be much the same, though likely with more of a reporting flavor at times. The hugeasscity.com site will become inactive, but will stay live as an archive.

This blog has become a far more interesting trip than I ever imagined. Many many big big thank yous to all you contributors and commenters and readers.

Below is my opening salvo at Publicola.

>>>

SUSTAINABLE URBANISM IS THE LEAST OF OUR WORRIES

Case in point: The above photo. We’ll get back to that.

But apparently enough of you find sustainable urbanism (whatever that means) to be sufficiently scintillating that the overlords of PubliCola were compelled to seek out a supplemental source of deep thoughts on said topic to feed the expansion of their new media empire.

So here’s what they did: they gobbled up hugeasscity. Greed. Is. Good. Or something.

And now contemplate this: hugeasscity is to lose its PubliCola virginity with this very post. I’m sure we all want it to be meaningful. And yes, sustainable cities are the key to the future prosperity of humanity and all that. And yes, the PubliCola hugeasscity column can be counted on to deliver the goods on that topic for the next several decades or until PubliCola is bought out by Rupert Murdoch.

But this  post is special. It wants to be about something deeper. Or else shallower. Or better, both at the same time.

Thankfully, the Coke machine in the photo spoke to me. ‘Cause the image on that mundane machine is so wrong on so many levels it hurts to think about it.

Seriously. What the hell kind of culture uses an image like that to sell stuff? It’s a very young child—a girl, I suppose we should assume—so what’s with all the glossy red lipstick? It’s sickeningly ambiguous. And that’s right, displaying this innocent babe sucking up nutritionless sugar water is a calculated strategy to get us all jazzed about what that machine has to offer. Sorry to get all potty-mouthed in my first post but let’s face it: That’s totally fucked.

On top of that, the U.S. has a widely discussed obesity epidemic. Still, simply because Coca-Cola’s executives have figured out a legal way to make piles of money, our culture can’t resist worshiping their success. Never mind that those piles come in exchange for empty calories derived from government subsidized corn. Yup, and right next to that machine is another one filled with corporate processed food. And both are conveniently located right next to the entrance to the building’s fitness center.

Which leads to a question:  How can we possibly hope to create sustainable cities when we are completely embedded with sociopathic institutions that churn out abominations like that Coke machine and the stuff inside it?

Truth be told, I think Coca-Cola on ice is delicious. And it’s great to be here on PubliCola. And worry not, hugeasscity fans, there will be pictures of buildings.

The Coolest Park & Ride Ever

As a rule, I try to keep my employer out of HAC, but recent discussions of park & rides combined with a bad case of Portland envy compel me to break that rule presently. For you see, my GGLO colleagues and I just responded to a call for concepts for Memorial Coliseum in Portland’s Rose Quarter. Our concept? Fill it with cars and make a gigantic park & ride out of it. Think I’m kidding? Go ahead, click those links. Here’s what we thunk up:

“We propose to repurpose Memorial Coliseum in a way that will foster Portland’s evolution into a model sustainable city of the future. Our concept begins with the counterintuitive conversion of the Coliseum into a colossal robotic parking garage. And it ends mid-century with the launching of a museum that celebrates the bygone era of the automobile.

“Portland has committed to reducing greenhouse gas emissions by 80 percent by 2050, which will require a two thirds reduction in driving. Over the same time period, the Portland area is projected to grow by 90 percent. Fortuitously, this growth can actually help Portland achieve its GHG goals by increasing density; and the positive impact is maximized if growth is targeted in areas that are already relatively dense, such as downtown Portland. However, under current trends, fitting parking in high-density development places a severe liability on the creation of livable communities. Parking is expensive, consumes vast area, degrades the pedestrian realm, and hamstrings design.

“Our interim solution is to provide parking in peripheral locations, thereby reducing the need for cars to enter the city core, and enabling the core to develop without the impediment of parking. The Rose Quarter is an ideal parking location to serve downtown Portland, as users would have several public transit options to reach their final destinations. We also propose a pedestrian bridge across the river to facilitate walking.

“The Coliseum building is well-suited to hold a modular robotic parking system, and could accommodate roughly 5200 cars. Ideally, it would be one of several such ‘Mobility Centers’ that would ring downtown. Over time, as the city grows and reliance on cars declines, these facilities would be relocated to less urbanized areas.

“Eventually, when parking is no longer needed in the Coliseum, we propose convert it back to a civic use, namely the Car Memorial Museum. The robotic parking apparatus would then be repurposed to store museum specimens (i.e. cars), and to retrieve them on demand for close up display to museum patrons.”

>>>

Anybody still with me? A thought experiment, yes, but not completely disconnected from reality. Because parking is a chicken/egg dilemma: we’d like to be able to design cities for people not cars, but since people are so dependent on cars, we continue to design cities for cars, which keeps people car dependent. Our proposed park & ride “moblity centers” could help break that vicious cycle.

Of course there are any number of reasons why such a model might fail. The biggest challenge would be getting people to use the park & ride given that it would make their trips less convenient. People would need a some kind of incentive to do it, the simplest solution being to make parking much cheaper there than in downtown.

The concept could also be criticized for the same reason some object to allowing park & rides in Seattle’s station areas—it’s infrastructure that’s supporting car use. On the other hand, it might be praised for many of the same reasons some believe it’s okay to allow park & rides in Seattle’s station areas—because it’s temporary, and has many potential side benefits.

But really, the coolest thing about this concept is the final incarnation of Memorial Coliseum as a museum to celebrate the bygone era of the fossil fuels and the automobile:  the “Car Memorial Museum.” By mid-century, the expectation is that central Portland will have become so dense, pedestrian-friendly, transit-rich, and car-free that the Rose Quarter Mobility Center would no longer be needed, and the Coliseum could be restored to a civic use.

Picture walking up to any one of several observation stations inside the museum, pressing a button to select the specific car from the collection that you would like to check out, and then having the robotic parking mechanism fetch the car and bring it to you, in the same way it once retrieved cars for their returning owners. Methinks we’d have a hit.

>>>

>>>

Parking Policy Pickle

[ Editor’s note: HAC is pleased to publish the following post by Sara Nikolic, Co-Director at Futurewise ]

The City’s no park-and-ride policy around light rail stations has long been contentious, and this past week the controversy  heated  up when several SE Seattle businesses were ordered to stop selling spots to commuters in their underutilized surface lots near the stations.  Yesterday, Mayor McGinn responded by imposing a 30-day moratorium on enforcement of the policy.

On the surface, the policy strikes many people as silly—or worse, counter to the goal of encouraging more people to take transit. After all, the dense and pedestrian-friendly transit-oriented communities that many expected to sprout up in advance of light rail have yet to materialize, and alternative modes of station access are underfunded, insufficient, and in some cases, unsafe.

And it’s true that if the goal is to maximize ridership in the short term, then the City should encourage parking at every station.  The park-and-riders would come, and the trains would be fuller.  

But unfortunately, pursuing that myopic goal would torpedo the long-term, transformative potential of the light rail investment.  The vision for these station areas—as articulated in the 2001 station area plans, and on track to be upheld in the neighborhood plan updates currently underway in three light rail station area neighborhoods—is the conversion of an auto-dominated area of the city into pedestrian friendly, mixed-use neighborhood centers where people can easily access light rail by foot, bike or bus. Allowing park and ride facilities is not only a flagrant disregard for that vision, but would also make it more difficult to achieve for two key reasons:

  1. In many cases, these surface lots are the very properties that the city hopes will redevelop to help create more dense and pedestrian-friendly transit-oriented communities. Allowing income generation from retaining the surface lots will delay the necessary tipping point at which it becomes profitable to redevelop the properties.
  2. Surface lots are hostile to pedestrians. They are unpleasant to walk along, and in poor lighting or with heavy traffic, can also be unsafe. Encouraging more cars to enter and leave these lots during peak commuting times, when people may be accessing the station by foot or bicycle, will only exacerbate safety issues.

But wouldn’t it be okay if the policy change is only temporary, as McGinn proposed?  Maybe.  But the difficulty of taking away something after it has been granted cannot be underestimated.  For instance, how would it be decided when was the optimum time for the parking ban to be reinstated? 

What’s needed here is patience. We will likely have to wait for the next development cycle before much building happens in the SE Seattle station areas, and they will remain less than ideal in the near term.  Because while the City had the vision in advance of light rail to implement policies that discourage auto-oriented uses, it unfortunately didn’t commit to the kind of meaningful public investment that would have catalyzed the creation of real transit-oriented communities.

The current economic slowdown presents a great opportunity for the City to make those investments out ahead of the next wave of development.  And that would entail addressing the very concerns that SE Seattle residents have raised for years: improvements to pedestrian and bicycle infrastructure, economic development, crime and safety, school funding.

But now is not the time to backpedal on policy and accept band-aid fixes that will ultimately hold back progress towards establishing the walkable, mixed-use communities that make so much sense for high-capacity transit station areas.

The consequences of banning park and ride lots in station areas are not unintended.  The policy resulted from a thorough planning process, and its goal is long-term progress. Nothing has changed between 2001 and now that justifies abandoning that important long-term vision.

“When I have nothing to say….”

…my lips are sealed
Say something once
Why say it again?”

EMP_maple

But thankfully, with the help of the fabulous interwebs, one can have nothing to say and still pretend to have something to say by copping what other people say. Watch me now: Apparently Alex Steffen was so bored this weekend he managed to crank out two great pieces, one on walkability:

The true test of walkability I think is this: Can you spend a pleasant half hour walking or on transit and end up at a variety of great places? The quality of having a feast of options available when you walk out your front door is what I starting to think of as “deep walkability.”

…A place that embraces deep walkability could almost be considered the very definition of a great city.

and one on green prosperity:  

Throughout much of the developed world, but especially in North America, the debate about sustainability is routinely framed as a trade-off between the environment and the economy. The problem is, no such trade-off exists…

The old economy is dead.

Connecting a few more dots on how transitioning to a green economy is a no brainer, first, we have Thomas Friedman prattling on again about green China (and as such, contradicting David Byrne, who couldn’t be more wrong about “why say it again?” when it comes to promoting massive cultural shifts):

We are either going to put in place a price on carbon and the right regulatory incentives to ensure that America is China’s main competitor/partner in the E.T. revolution, or we are going to gradually cede this industry to Beijing and the good jobs and energy security that would go with it.

And then there’s the new AP report that found stimulus spending on road construction has not led to gains in employment:

Ten months into President Barack Obama‘s first economic stimulus plan, a surge in spending on roads and bridges has had no effect on local unemployment and only barely helped the beleaguered construction industry, an Associated Press analysis has found.

So on top of it being a bad long-term investment in terms of creating green prosperity, road building also appears to be a bad short term investment. Brilliant.

Meanwhile, we have learned that a stimulus dollar spent on transit provides about twice as many jobs as a dollar spent on highway infrastructure:

…for every billion dollars spent on public transportation projects, 16,419 job-months were created. A billion dollars spent on highway infrastructure projects created only 8,781 job-months.

I’ve got nothing to say about any of this.

File Under Portland Envy

This past October the Portland City Council adopted a new Climate Action Plan, coauthored by the City and Multnomah County. The Plan includes a greenhouse gas (GHG) inventory, similar to the report recently published by the City of Seattle, but that’s where the similarity ends. Because apparently unlike Seattle, Portland is taking the issue of climate change seriously enough to follow up their GHG inventory with in-depth analysis, goals, and proposed actions.

The Portland/Multnomah County GHG inventory results look a lot like Seattle’s, with two notable exceptions. First, Multnomah’s total emissions have not fallen as much as Seattle’s—in 2008, Multnomah County’s emissions were one percent below 1990 levels, as compared to the seven percent drop achieved in Seattle. Seattle fared better because of larger reductions in emissions from the industrial and building sectors.

Second, Multnomah’s inventory doesn’t include air travel, so with that subtracted from Seattle’s data, Seattle wins the per capita emissions contest—9.2 metric tons per person per year compared to 11.9 metric tons in Multnomah. But, as has been discussed previously, the low carbon intensity of Seattle’s electricity complicates interpretation of these data points. In 2008, per capita electricity consumption was nearly the same—13,355 kWh in Seattle, and 12,074 kWh in Multnomah—but the per capita GHG emissions associated with that electricity use were 21 times higher in Multnomah than in Seattle.

It’s debatable how to account for regional elements like the electricity grid in local GHG inventories. But if Seattle gets credit in the GHG reduction contest for taking the initiative to build hydropower dams, then they also have a corresponding responsibility for the decimation of the salmon runs, which impacts the entire Pacific Northwest.

Another artifact of the higher carbon intensity electricity in the Portland area is a reduction of the relative contribution of transportation to total GHG emissions—it’s 38 percent in Multnomah, compared to 62 percent in Seattle. But that doesn’t mean people are driving less in Seattle. Depending on who’s numbers you believe (e.g. here, here, here, or here), per capita vehicle miles traveled in both places are in the range of 20 miles per day.

The short story is that carbon footprints are similar in Seattle and Portland because people’s lifestyles are essentially the same in both cities. But one marked difference between the two cities is how they followed through on all that GHG data they collected. Seattle’s analysis was minimal, as noted in previous posts (here, here, and here). In contrast, Portland uses the GHG inventory as a foundation upon which to build and extensive set of goals and actions for addressing climate change.

Reduction targets are established for 2030 and 2050. Goals and actions are divided into broad range of categories: Buildings and Energy; Urban Form and Mobility; Consumption and Solid Waste; Urban Forestry and Natural Systems; Food and Agriculture; Community Engagement; Climate Change Preparation; and Local Government Operations. And it’s all packaged up in a 70 page document with great graphics and thoughtful writing. The table below provides a good summary.

>>>

Portland envy among urbanists has become a cliche, and there may well be more hype than substance. But still, there is something palpably exceptional about Portland’s approach to promoting sustainable urbanism, and in particular they always seem to be a few steps ahead of Seattle. For example, here’s a list of Portland area organizations that contributed to the Climate Action Plan:

  • City of Portland Peak Oil Task Force
  • Portland and Multnomah County Sustainable Developoment Commission
  • Portland and Multnomah County Food Policy Council
  • Mayor’s Planning and Sustainability Cabinet

Did you catch that? Portland has an official Peak Oil Task Force. Here in Seattle I get the sense that most of our electeds are uncomfortable even uttering those words. And that last item in the list sure has a familiar ring to it.

It’s a curious thing, this cultural contrast between Portland and Seattle. Demographically, the populations are almost indistinguishable. At the risk of overly generalizing, perhaps the most pertinent difference between the two cities is that Seattle is more “corporate.” Is it as simple as that?

Prospects for Affordable Housing in Seattle

In the new issue of AIA Seattle Forum focussing on the “Architecture of Inclusion.”  Read the whole thing here.

>>>

Forum p10

>>>

Layout 1

UPDATE: Here’s the pie chart that was mistakenly left out of the published article:

“That mature attitude seems to have largely vanished.”


[ Snowpocalyspe 2008, on Union near 23rd Ave ]

David Brooks—who doesn’t always suck—wrote in a recent column:

Now we seem to expect perfection from government and then throw temper tantrums when it is not achieved. We seem to be in the position of young adolescents — who believe mommy and daddy can take care of everything, and then grow angry and cynical when it becomes clear they can’t.

Case in point—the Seattle Times editorial board’s take on the resignation of SDOT director Grace Crunican:

Mayor Greg Nickels refused to fire Crunican out of loyalty and a sense that her overall performance on projects such as “Bridging the Gap,” designed to improve roads and sidewalks, was done quite well. Maybe it was. But a crisis is the time when leaders prove themselves — and Crunican and her staff let down the decent, snowbound citizens of Seattle.

Translation: “maybe” mommy and daddy did a good job on the critically important, long-term challenge of transforming Seattle’s transportation culture, but who cares, cause mommy and daddy couldn’t wave a magic wand and make all the snow go away, and so the “decent” citizens of Seattle had every right to throw a tantrum.

So the question is, by pandering to this kind of infantilism, is the Seatimes editorial board simply reflecting the soul of Seattle? I’d like to think that they’ve got it wrong, that it wasn’t petty politics that took down Crunican, and that McGinn is letting her go only because he believes he can find someone who will be more effective at building sustainable transportation solutions for Seattle. Above all, I hope the latter proves true, but it’s going to be a tall order.

Don’t Worry, It’s Probably Nothing


[ Excavation at 505 1st Ave; photo: Scott Durham ]

What fun it must have been excavating the 4-story underground parking garage for the new Starbucks building at 505 1st Ave S, as shown in the photos (thank you Scott at CD News). The spectacular mess they encountered—reportedly extending down as far as 40 to 50 feet—is typical of the fill that is found along the south waterfront, west of 1st Ave. It consists of leftover debris from the historic sawmills, along with the remains of the piles that once supported the piers and overwater railroad tracks that were built when the area was still a tidal flat.

The latest plan for the deep-bore tunnel moves the alignment from 1st Ave to Alaskan Way for the section south of Yesler Way. Which means the tunnel now has to traverse a massive underground heap of that unruly fill for about five city blocks.

Worth worrying about? Dunno. Perhaps deep-bore tunnel machines eat that kind of fill for breakfast. Perhaps the tunnel will be deep enough to go under it, and perhaps chewing a 54-foot diameter hole can be done without disturbing unstable fill above. Any experts out there care to weigh in?

If nothing else this a good example of the unanticipated complexities that inevitably arise when a mega-project starts to get real. For a good reality check on the potential challenges facing the deep-bore tunnel project, see Cary Moon’s recent Crosscut piece.* And this is why megaprojects so often go over budget. And this is why being on the hook for cost overruns matters.

But the bigger question this all circles back to is this: Why are we taking on the huge risk and expense of a piece of mega-infrastructure we don’t need?


[ Excavation at 505 1st Ave; photo: Scott Durham ]

>>>

*Annoyingly, though alas, not surprisingly, the Crosscut editors headlined Moon’s piece “Tunnel Worries,” thereby framing it as the emotional ramblings of an amateur rather than what it actually is—that being serious analysis by one the City’s most knowledgable experts on the viaduct replacement issue.

Time Passages (They Grow Up So Fast)


[ 4.30.08: John and Pontius ]


[ 8.29.09: John and Pontius ]

>>>
>>>
>>>


[ 4.25.08: Denny and Westlake ]


[ 6.24.09: Denny and Westlake ]

>>>
>>>
>>>


[ 4.25.08: Taylor and Denny ]


[ 7.20.09: Taylor and Denny ]

>>>
>>>
>>>


[ 5.5.08: 8th and Columbia ]


[ 6.4.09: 8th and Columbia ]


[11.17.09: 8th and Columbia ]

>>>
>>>
>>>


[ 5.5.08: 7th and Madison ]


[ 11.3.09: 7th and Madison ]


[ 11.17.09: 7th and Madison ]

>>>
>>>
>>>


[ 2.23.08: 9th and Jefferson ]


[ 11.17.09: 9th and Jefferson ]

>>>
>>>
>>>


[ 2.23.08: 5th and Yesler ]


[ 6.23.09: 5th and Yesler ]

>>>
>>>
>>>


[ 3.13.08: 8th and Olive ]


[ 4.7.09: 8th and Olive ]

>>>
>>>
>>>


[ 10.21.08: Terry and Stewart ]


[ 4.21.09: Terry and Stewart ]

>>>
>>>
>>>


[ 7.8.08: 8th and Westlake ]


[ 3.19.09: 8th and Virginia ]


[ 9.09: 8th and Westlake from 5th Ave ]

>>>
>>>
>>>


[ 2.13.08: 2nd and Pike ]


[ 10.2.09: skyline ]

>>>
>>>
>>>


[ 3.18.08: 4th and Virginia ]


[ 8.30.09: 4th and Virginia from Westlake ]


[ 10.2.09: skyline ]

>>>
>>>
>>>


[ 11.25.07: Jackson and 18th ]


[ 12.13.08: Jackson and 17th ]


[ 12.8.09: Jackson and 18th ]


[ 11.17.09: 17th and Jackson ]

>>>
>>>
>>>


[ 10.5.08: 19th and Yesler ]


[ 11.3.09: 19th and Yesler ]

>>>
>>>
>>>


[ 11.28.08: 21st and Union ]


[ 2.7.09: 21st and Union ]


[ 7.11.09: 21st and Union ]

>>>
>>>
>>>


[ 12.20.07: 14th and Union ]


[ 6.26.08: 14th and Union ]


[ 4.12.09: 14th and Union ]


[ 12.24.09: 14th and Union ]

>>>
>>>
>>>


[ 12.27.07: 15th and Madison ]


[ 7.14.09: 15th and Madison ]

>>>
>>>
>>>


[ 10.4.08: 12th and Pine ]


[ 12.24.09: 12th and Pine ]

[ 11.17.09: 12th and Pine ]

>>>
>>>
>>>


[ 12.26.07: Broadway and Mercer ]


[ 12.26.07: Broadway and Mercer ]

>>>
>>>
>>>


[ 12.24.07: 11th and Denny ]


[ 8.1.09: 11th and Denny ]

>>>
>>>
>>>


[ 12.24.07: Denny and Nagle ]


[ 10.18.09:  looking north from Denny and Nagle ]


[ 12.24.07: inside Vivace at Denny and Nagle—this building is no more ]

>>>
>>>
>>>

Design Standards Ordinance FAIL

Take a minute to admire the adorable tacked-on faux balcony in the photo above. And now thank the genius code writers of Leavenworth, WA. Cause apparently, if you want to put up a commercial building more than one story tall in Leavenworth, a nordic-style balcony it must have. Not that it has to be usable.

Back in the 1960s when Leavenworth was in decline, the town opted for Extreme Makeover: Mock Bavarian Village Edition. The historic brick downtown was stuccoed, balconied, and gabled. And amazingly, it succeeded brilliantly. The blatant cheesiness of fake balconies and such only seem to add to the kitschy charm of the place.

Another striking result of the Leavenworth design standards is a gaping lack of the gigantic, brightly colored, in-your-face corporate signage that dominates the look of most U.S. downtowns. That “M” is all that the global superpower of fast food could get. There’s a Bank of America, but without the usual array of glowing red and blue signs yelling at you. The reduction of visual pollution is palpable.

Now admire the screaming yellows, reds, and whites of the Shell station located in the heart of the Pike/Pike Conservation Overlay District in Seattle (photo below). This gas station is by far the most out of character structure in the entire district. And it’s no accident—those painful colors are specifically chosen to grab the eyeballs of the rapidly passing motorist.

Note also that the gas station use is completely inappropriate for one of Seattle’s most pedestrian-oriented neighborhood centers—all the more so because it’s located on the corner of a prominent intersection. It would be great to see some of the neighborhood activists’ take on that Shell station as public enemy number one.

As ridiculous as Leavenworth may be, perhaps Seattle could learn something from how they successfully implemented design standards that trump the entrenched habits of corporate America. Why do we put up with loathsome scars like that Shell station?

Yes Virginia, Density Causes Sprawl—Lorax Edition

Among  all the wonderous myths of the density NIMBYs, surely “density causes sprawl” is king. Long ago Yogi Berra, of all people, nailed the illogic of that argument with his famous quip that “Nobody goes there anymore. It’s too crowded.”  (Mr. Berra also coined “it’s deja vu all over again,” a sentiment that seems all too fitting for another density post on this blog, but hey, it’s been a while.)

Like most specious myths, there is a grain of underlying truth upon which the broken ediface is built. Because yes, from the dawn of cities to the present, those with the means sometimes choose to escape the ills of the crowded city to find more favorable living conditions on the fringe.

But that is not the operative dynamic in a growing city like Seattle. Here, people opt for the fringe because they don’t have the means to afford Seattle. And that’s because demand for housing is high in Seattle, which is because there’s limited supply, which is because Seattle isn’t dense enough.

Yet somehow the myth persists that all those new, big, scary multifamily buildings filling up with people are actually driving people out of the city and increasing sprawl. Never mind considering where all those people would have gone to live if there were no new, big, scary multifamily buildings for them to move into.

There’s also a corollary myth regarding tree cover—that taking out trees to make way for new development creates sprawl because no one wants to live in a city that doesn’t have enough trees. Except, of course, all the people who are moving in to that new development that took out the trees. Pesky details.

But here’s the punchline of the post: the source of the tree corollary appears to be none other than the public servants of the City of Seattle itself. The City’s 2007 Urban Forest Management Plan states that,

Accommodating growth is important in order to preserve open spaces outside of the city. However, the loss of treed relief in our built environment reduces livability and further motivates sprawl.

and also that,

As the pressure to redevelop land within Seattle continues and the region’s population increases, density goals and development pressures need to be balanced with tree protection and planting goals. Finding the right balance is crucial to maintaining the city’s livability and encouraging new development within already developed areas rather than pushing it to the metropolitan fringe.

It sounds reasonable on the surface, and yes, trees are important for livability. But poke below that surface and say hello to bald-faced illogic: We must hold back development to prevent the loss of trees and preserve livability so that we can accommodate dense development that will cause loss of trees. Capiche?

And here’s another fun irony: If Seattle invests in expanding tree cover, it’s only going to make the City even more desirable. And that will further raise housing prices—a true generator of sprawl—and also increase development pressure.

What’s needed is some perspective. We all agree that trees have significant value on many levels. But if, for example, we think trees are important for carbon sequestration, we must consider how that fits into the big picture. The Urban Forest Management Plan estimates that Seattle’s existing trees sequester 52,400 Mg CO2/yr. How much is that? It’s 0.8 percent of Seattle’s total carbon footprint.  

But we also know that as density goes up, driving—and the associated carbon emissions—goes down. Just a two percent decrease in road transportation emissions would offset the sequestration provided by all of Seattle’s existing trees.

Same goes for stormwater management. The Plan places a $21 million stormwater mitigation value on Seattle’s existing trees. How does that compare to other mitigation strategies that can be integrated with dense development such as green roofs? And what about the impervious surface that is avoided with dense infill development—how much does that save us in terms of runoff pollution to Puget Sound, for example?

The list goes on. But the point is that planning decisions must be based on defensible analysis.  Does Seattle’s 30 percent tree cover goal meet that requirement?

>>>

Whether it’s about trees, ugly buildings, traffic, etc, there appears to be a fantasy scenario being invented in the minds of density NIMBYs in which people are fleeing Seattle because of all the terrible development that’s been happening.  But they’re doing no such thing. Plenty of people still want to live in Seattle—that’s why housing is so expensive here. 

Take Belltown, for example, often maligned for growing too rapidly without providing sufficient open space and schools. But somehow rents are still among the highest in Seattle. Maybe we should ask the people who choose to pay those rents whether or not the neighborhood is a success. And again, we’re faced with the gotcha: add more open space to Belltown and rents are going to go even higher (you may be feeling the pull toward a discussion of affordable housing, but we’re not going there now) .

None of this is to say that “livability” isn’t a critical ingredient of urban density (file under stupid-simple). Density advocates have expended an enormous amount of energy articulating their vision for how density can be livable, while at the same time helping us become more sustainable. If some folks disagree, that’s fine. But that disagreement is empty rhetoric if it isn’t backed with a credible alternative vision and plan. I’m still waiting.

Seattle’s Transportation Carbon Footprint: Can Electric Cars Save Us?


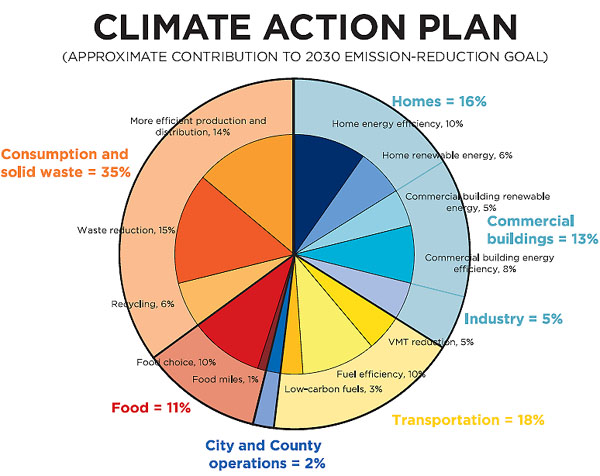
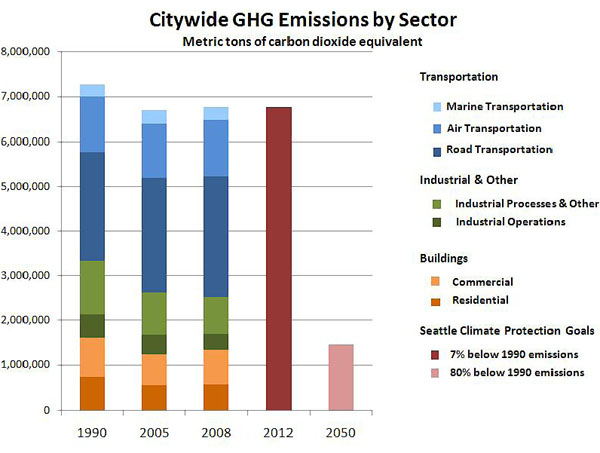
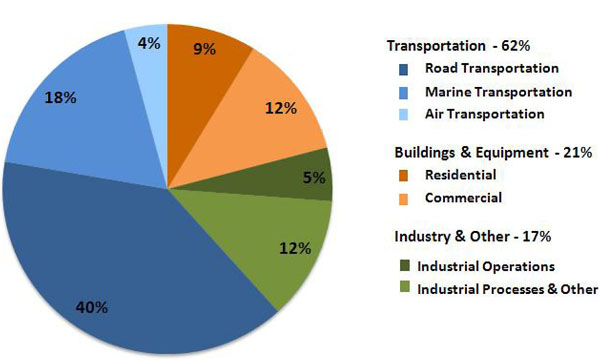
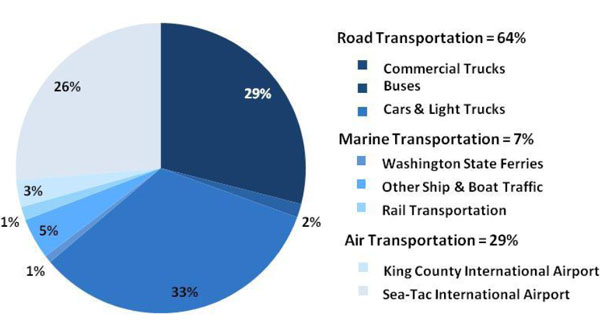
[ Seattle’s 2008 GHG emissions from the transportation sector, which accounts for 62 percent of total emissions ]

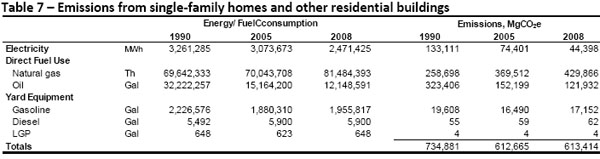
Transportation is not only the single largest source of Seattle’s greenhouse gas (GHG) emissions—accounting for 62 percent—but it is also the only sector from which emissions are still escalating: Seattle’s GHG inventory shows a seven percent increase in emissions from the transportation sector between 1990 and 2008.

There are two ways to reduce transportation emissions: travel less, or increase vehicle efficiency.

First, a word about air transportation: wow. It’s a remarkably large chunk of the transportation footprint considering how small a part of our typical daily lives air travel is compared to driving. Airplanes have passenger-mile efficiencies in the same range as cars—it’s the long travel distances that rack up the GHG emissions. Barring an unexpected breakthrough, it is unlikely that airplanes will ever become significantly more efficient. (Translation: airline stocks are not a wise long-term investment.)

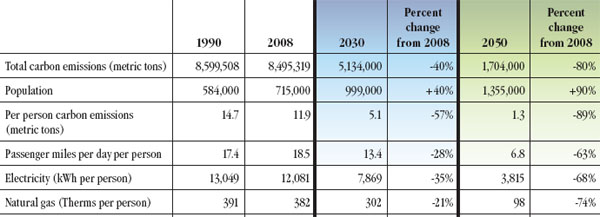
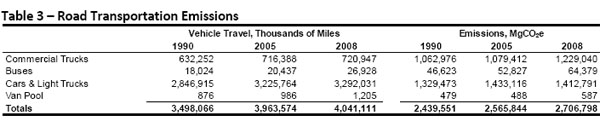
Road travel constitutes nearly two thirds of Seattle’s transportation-based carbon footprint, and it also accounts for most of the increase in emissions since 1990. Crunching the road vehicle miles traveled (VMT) data shown in Table 3 below reveals that per capita VMT in Seattle were nearly identical in 1990 and 2008 (with a slight bump in 2005). In other words, VMT have risen at the same rate as population growth. From 1990 to 2008, passenger vehicle fleet efficiency increased by about nine percent, but that was not enough to offset the increase in emissions due to more driving.

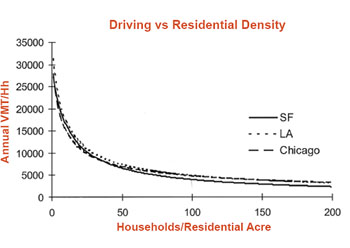
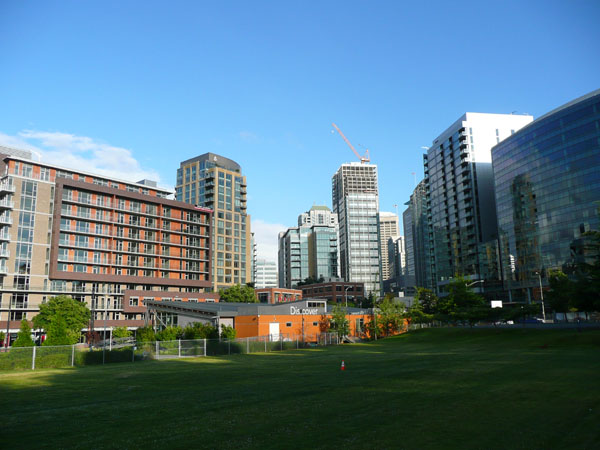
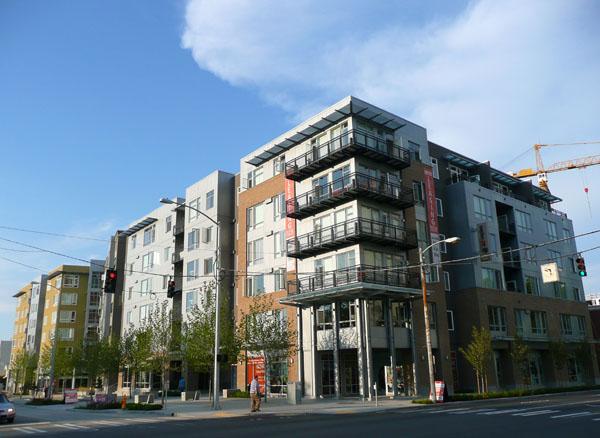
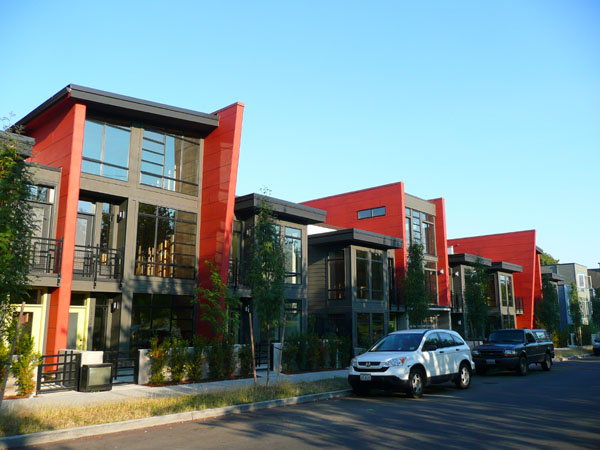
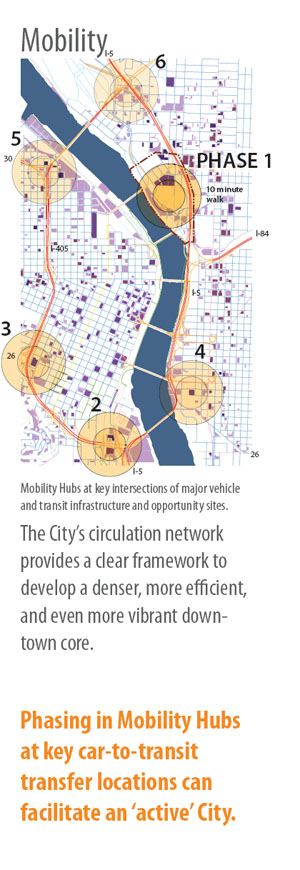
The most promising strategy for reducing travel in personal vehicles is to create compact, walkable neighborhoods served with high-quality transit. This topic has been covered many times on this blog, and the case is made at length in Transit-Oriented Communities: A Blueprint for Washington State, the new report by Futurewise, GGLO, and Transportation Choices Coalition. The graph on the left is a concise summary the story:  population density is a proxy for the important physical ingredients of transit-oriented communities, and as density goes up, VMT go down.

But some contend that restructuring our built environment is too expensive and will take too long to be an effective response to climate change, and therefore that our focus should be on increasing vehicle efficiency. And the type of vehicle most often touted is the electric car.

Like most urbanists, my feelings about cars were well captured by Lewis Mumford when he wrote, “Forget the damned motorcar and build the cities for lovers and friends.” But has that bias resulted in unfair dismissal of solutions that don’t involve getting rid of cars? Given the dire threat of the climate change, we can’t afford to be hamstrung by such biases.

So the first question to answer is: How much more electricity would be needed if Seattle’s entire fleet was converted to electric vehicles?

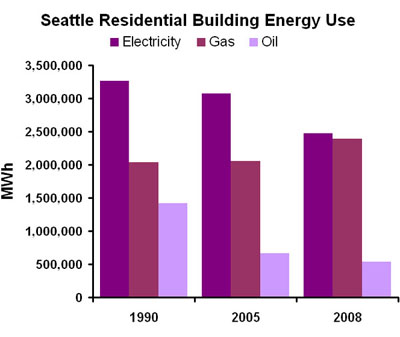
The Nissan Leaf can travel about four miles on one kWh of electrical energy. But since many people need larger cars and light trucks let’s assume an average of 3 miles per kWh for the fleet. The 3,292,031,000 miles traveled by cars and light trucks in Seattle in 2008 would consume about 1,100,000 MWh. That represents a 14 percent increase over Seattle’s total 2008 electricity consumption of about 8,000,000 MWh (data from this report). An all electric fleet of commercial trucks—which are about one fourth as efficient as cars and light trucks—would require another 12 percent.

Thus, the total conversion would add about one quarter to Seattle’s current electrical demand. First reaction: that’s a lot less than I would have guessed given all the kinetic energy involved—we’re not talking about needing to double or triple electricity production or anything totally unfeasible like that.

And what would be the impact on GHG emissions? Because our regional carbon-free hydropower capacity is tapped out, new electrical demand is typically treated as “marginal,” with an emissions factor that assumes electricity is generated from fossil fuels. As discussed in this post, a 3 mile/kWh electric car using marginal electricity with an emissions factor of 600 grams CO2 per kWh, would emit 200 grams of CO2 per mile. Applying those assumptions, the full electric conversion would cut Seattle’s road transportation emissions about in half, which would reduce the City’s total carbon footprint by about one fifth.

That’s a big reduction, but unfortunately still not enough. Though there are two factors that could boost the upside of electric vehicles:

  • Our electricity will become less carbon-intensive over time as renewables come on line, resulting in a corresponding drop in GHG emissions associated with electric vehicles.
  • Electric cars can charge during off-peaks hours (at night) to take advantage of underutilized electrical generation capacity. And they also could be used as networked storage devices to feed power back to the grid when advantageous.

Of course, there are also many downsides left out of the above analysis:

  • There are significant GHG emissions resulting from car use in addition to those associated with simply propelling the car. For example, Toyota estimates that manufacture accounts for 30 percent of a Prius’ lifetime GHG emissions. In addition, the infrastructure required for cars is a source of GHG emissions—one study estimates that roadway construction and maintenance adds another 26 percent to the GHG emissions associated with operating a conventional car.
  • Rising fossil fuel costs and carbon pricing will inevitably result in rising demands on carbon-free electricity from all sectors, and electric vehicles may end up competing for energy needed to supply the basics, such as heating homes.
  • The Puget Sound region is projected to grow by 1.6 million people by 2040, an increase of more than 40 percent. If we do nothing other than convert our fleet, we can expect VMT to rise proportionally. And in this scenario, we’d have to choose between a massive amount of road building or total gridlock. Note that this this scenario would also mean a forty-plus percent increase in electricity consumed by electric vehicles.
  • Electric cars are expensive (it’s all about the batteries). A new $30k electric car for every Seattle household would cost about $9 billion—more than twice the City’s total annual budget of $3.9 billion.
  • And lastly, electric cars, like conventional cars, inherently cause a host of negatives, including accidents, high cost of ownership, sedentary lifestyles, social isolation, land consumption, impervious pavement, and the proliferation of terrible urban design.

So then, do we have a verdict on electric cars?  First of all, like most ideas applied to the real world, they are not a silver bullet solution.  In the short term, it makes sense to get a lot more electric vehicles out on the road as soon as possible, simply because they are much more energy efficient than conventional motor vehicles. 

In the long term however, it is delusional to think that we can go on with car-centric business as usual if we simply switch to electric vehicles.  Indeed, our future prosperity will be determined to a large degree by how successfully we reduce reliance on cars.  And that means reshaping our urban areas such that (1) people can meet many of their daily needs with short trips that can be made on foot or bike, and (2) convenient public transit is available for longer trips. (Hint: some folks like to call such places transit-oriented communities.)

Winter Light

Tunnel Resurfacing

Yonah Freemark recently wrote on The Infrastructurist that Seattle’s proposed deep-bore tunnel is one of “The 4 Highway Projects that Would Be the Biggest Waste of Money.”

Meanwhile Mayor-elect McGinn is still questioning the cost overrun provision,  House Speaker Frank Chopp might want to play, but head of the House Transportation Committee Judy Clibborn definitely doesn’t. 

And the reality that the tunnel portals will have major impacts is also starting to get more attention, at the north portal, but more importantly, at the south portal right next door to Pioneer Square and the stadiums.

The idea that the tunnel is a waste of money is not new, and as the debate is not over, this 2006 study on the “No-replacement Option” is good refresher course.  Lots juicy info, like how conservative modeling done by Parsons Brinckerhoff estimated that 28 percent of trips would disappear as people adapt their routines.  And choice myth busting: 

Myth #1 – Most Alaskan Way Viaduct trips are long distance trips through the city
Myth #2 – AWV is critical for freight movements
Myth #3 – The downtown street grid lacks capacity to move additional traffic
Myth #4 – There is a traffic “demand” that is independent of roadway supply

Responding to concerns over compromised connectivity between north and south Seattle neighborhoods, the authors write:

Here is an alternative view. If people shop and use services closer to where they live, this is a positive contribution towards Seattle’s goals for vibrant neighborhoods and sustainability.

Exactly.  We know that cars are our region’s single biggest source of greenhouse gas emissions, and we know that reducing vehicle miles traveled—as mandated by State law—is a huge challenge.  What’s not as evident to many is that this does not have to be a sacrifice:  reducing car-dependence and localizing communities can actully make life better for people.

UPDATE:  New plans for the south portal have just been posted here.

Seattle’s Greenhouse Gas Inventory: Buildings

As noted in a previous post, the most striking success revealed in Seattle’s latest greenhouse gas (GHG) inventory is in the residential building sector: between 1990 and 2008, per capita GHG emissions dropped by 28 percent. To make sense of that, it helps to take a look at the residential energy data provided in the City’s full report, plotted below (taken from Table 7 at the bottom of the post):

In Seattle’s residential building sector, between 1990 and 2008 total energy use fell by 20 percent, which, given the 16 percent growth in population during that time, is equivalent to a per capita reduction of 31 percent. That’s a lot. What happened?

The only reason the City’s report cites is conversion from oil to gas furnaces. One can speculate that tighter energy codes and efficiency upgrades (e.g. CFLs, insulation, etc.) also contributed.  But here’s the thing:  we seem to have made big improvements in our residential energy efficiency without really even trying that hard.  It would be great to see some deeper analysis from the City on this, to help us better understand our progress.

The 20 percent drop in electricity use between 2005 and 2008 is curious—such a large decrease over a relatively short time period seems improbable. Either it’s bad data, or there’s something significant going on that we need to identify. The City report attributes the increase in gas use between 2005 and 2008 to an unusually cold winter—but many Seattle buildings are space heated with electricity, and thus one would also expect electrical demand to rise in cold weather.

So then, what could have had a big enough impact to cause that 20 percent net decrease in residential electricity use over three years? The recession? Lots and lots of CFLs?  OSE or SCL, can you help us out here?

As is shown in Table 8 at the bottom of the post, unlike residential, commercial building energy use increased significantly between 1990 and 2008. Which raises an obvious question:  why is residential doing so much better than commercial at improving efficiency?  It matters, because the commercial sector consumes nearly twice the electricity that the residential sector does. Note also that there is a small drop in electricity use between 2005 and 2008, analogous to what was seen in residential. Related? The recession would seem to be a more plausible explanation in this case.

>>>

Now, to get a little deeper into the geeky weeds…

As can be seen in the bar chart, the dominant source of energy for residential buildings is electricity, but thanks to Seattle City Light and hydro dams, GHG emissions from electricity are relatively low compared to emissions from gas and oil (see GHG table here). If, however, Seattle’s electricity was like the average in the U.S, in 2008 the associated GHG emissions would be multiplied by about 38 times.

Again, since the electrical grid is regional, it seems it would be more realistic to apply a regional emissions factor to GHG inventory calcs. For the region encompassing WA, OR, and ID, the average emissions factor is about eight times larger than the emissions factor used in the 2008 Seattle inventory.  And yes, that means the estimated GHG emissions from electricity would be eight times higher than the data points reported in the Seattle GHG inventory.

If the City of Seattle plans to develop policies based on GHG inventories, then care must be taken not to neglect the importance electricity simply because a localized interpretation says our particular electrons are carbon-free. And overall, since Seattle’s tentacles extend far beyond its borders, an honest accounting of GHG emissions must not be artificially bound by city lines.

UPDATE:  See Sightline’s related post on GHGs and regional electricity.

>>>

Seattle’s Carbon Footprint: Assessing The Assessment

The City of Seattle just released its 2008 greenhouse gas inventory, and in most of the media reports, the results get distilled down to this headline:  Seattle’s emissions are seven percent below 1990 levels. Or perhaps even further distilled to:  Seattle is meeting the Kyoto protocol. Sure sounds good, but the reality is much more mixed and messy.

The big trend that the bar chart above shows is that greenhouse gas (GHG) emissions dropped significantly from 1990 to 2005, then inched back up slightly in 2008.   (See the table below the jump for the numbers.) What has happened since 1990 that caused the net reduction in emissions even as population grew by 16 percent?  In short, the main reasons are:

  • automobile fleet efficiency rose by nine percent, which offset much of the increase in vehicle miles traveled
  • total energy use in residential buildings decreased, even as the number of households grew
  • energy use in the industrial sector decreased (though the report does not say how much of this may be due to a decline in industrial activity)
  • the GHG emissions factor for Seattle’s electricity is less than half of what it was in 1990

There’s a lot buried in those four bullets, too much for one post. The second point is the most unambiguous  success story for Seattle.

But the last point highlights a key Seattle idiosyncrasy that is critical to honestly assessing our carbon footprint:  89 percent of our electricity is carbon-free hydropower.  And since transportation uses very little electricity, for Seattle the blue pieces of pie become much bigger in the chart below.  For the U.S. as a whole, transportation accounts for only about a third of GHG emissions.

Although Seattle City Light (SCL) is technically carbon-neutral, the Seattle inventory attributes a small amount of GHG emissions to electricity use—for 2008, the report assumes an emissions factor for  Seattle that is a mere three percent of the U.S. average. SCL has reduced their emissions factor over the past decade or so by shifting their fuel mix from fossil fuels to renewable sources such as wind, and by purchasing carbon offsets.  Thus, even if electrical energy use had remained constant since 1990, the inventory would have shown a decrease in emissions.

It’s great that Seattle has access to low-carbon electricity, but unfortunately that fact can also lead to misperceptions about our current status and where we should be focusing future efforts. For one thing, it’s not exactly fair for Seattle to tout its low carbon footprint compared to other cities when the main reason for it is that we happen be located near some big hydropower dams that were built before anyone even knew what a global greenhouse gas was.

Just because electricity consumption in Seattle produces relatively little GHGs, we should be trying to reduce electricity use just as much as any other city for two reasons:  (1) the electricity grid is regional, and every clean kWh that’s not used here in Seattle is a clean kWh that becomes available somewhere else, and (2) our hydropower is maxed out, and global warming is expected to decrease capacity as mountain snowpack is reduced.  Furthermore, if we hope to start using electric cars on any significant scale, all that electricity has to come from somewhere.

The regional nature of electricity underscores the complexities involved with any attempt at a truly comprehensive GHG inventory for a specific area:  the factors that drive GHG emissions cross boundaries—a city gives and takes from a much larger surrounding system—effectively the entire planet, in fact.  And this presents a major challenge to the viability of city-specific goals, such as the recently proposed goal to make Seattle carbon-neutral by 2030.  We don’t yet know how that would even be defined, much less measured accurately.

But the Seattle inventory is a great start at “measuring what matters.”  It captures most of the major sources, and we can build on it.  Below are some random ideas on what it’s missing, the unknowns, possible improvements, etc:

  • How we account for road travel across city limits?  Currently only VMTs within the city are counted.    Consider the example of a bedroom suburb where most commuters work elsewhere.  Such a community should bear some of the responsibility for the emissions produced by residents who have to travel outside community boundaries to meet the daily needs of their lives.
  • Food systems are a major source of GHGs—meat production alone produces and estimated 18 percent of global emissions.  Much of the emissions associated with food systems is captured in the standard sectors, but the bulk of food production and transport occurs outside a typical city’s boundaries.  How would city full of a “locavore” vegetarians get due credit for the associated GHG reductions?
  • The consumer products we devour require raw materials, processing, transport, and disposal, all of which produce emissions.  Again, how do we account for the fact that most of all that happens outside the city?  And how do we divide the responsibility for emissions between those who profit from the manufacture and sale of a product, and the end consumer of that product?
  • The construction of infrastructure and buildings produces GHG emissions—a.k.a. “embodied carbon”—much of which is associated with materials that are typically brought in from far afield.  Also, the existing built environment represents an embodied carbon “bank” that we effectively draw against when we demolish existing structures.  The full embodied carbon impact of development needs to be a part of the inventory.
  • Carbon offsets are a worthwhile strategy, but I believe they should not be included in GHG inventories, because they are analogous to handing the problem to someone else, and they also can mask the data that matter most—actual emissions.
  • And lastly, how do make sure that focusing on GHGs doesn’t cause us to neglect other related impacts, such as how our Pacific Northwest hydropower dams have decimated what were not long ago the largest salmon runs on the planet.

The above points highlight that the establishment of a defensible inventory methodology is as challenge commensurate with the infinitely messiness of human systems.  But it’s about time we got busy understanding our mess.

>>>

GHG data table after the jump…

Read the rest of this entry »

Information Is Beautiful

Click on the image to see the whole enchilada.  Via the amazing Information is Beautiful.

The Editorial Boards Of The Wall Street Journal And The Washington Post Are In Agreement: 2+2=5


[ Nick Anderson; The Houston Chronicle ]

In Tuesday’s Wall Street Journal the paper’s deputy editorial page editor Bret Stephens writes, “The earth has registered no discernable warming in the past 10 years… Am I missing something here?”

Could be.

On Monday the World Meteorological Organization issued a press release stating: “The decade of the 2000s (2000–2009) was warmer than the decade spanning the 1990s (1990–1999), which in turn was warmer than the 1980s (1980–1989).” And also: “The year 2009 is likely to rank in the top 10 warmest on record since the beginning of instrumental climate records in 1850.”

NOAA also issued a press release on Monday, stating: “The 2000 – 2009 decade will be the warmest on record, with its average global surface temperature about 0.96 degree F above the 20th century average. This will easily surpass the 1990s value of 0.65 degree F.”

Though thoroughly debunked, the “stable temperatures over the past 10 years” myth lives on in the minds of the WSJ editorial board and no doubt a good chunk of their 2.1 million readers, whose average annual income is upwards of $190,000.

Yes, we all know that the WSJ editorial page is notoriously conservative, and that the paper is now owned by Rupert Murdoch—okay sure—but it also happens to have the widest circulation of any U.S. paper, and a highly influential readership. What does it mean that this paper can get away with publishing something so wrong on such an important issue? Not to mention that Stephens’ piece is so loaded with comically absurd paranoia that it could easily be mistaken for something from the Onion—it even has a picture of Lenin in Red Square.

Not to be outdone, today the Washington Post published an op-ed by world-renowned climatologist Sarah Palin, the second time in five months that they’ve offered her a national platform to share her climate change expertise.  Palin is one of the few scientists in the world that we must take deadly seriously when she contradicts the findings of the IPCC with her bold assertion that “we can’t say with assurance that man’s activities cause weather changes.”  Gratefully, I defer to Joe Romm’s take down.

And in case you missed it, last Sunday George Will—arguably the nation’s biggest living blowhard—typed out some more of his typical pompous bloviations, peppered with gems like “faith-based global warming community” and “(postulated) consensus,” and “substantially diminished freedom.”  Again I defer to Joe Romm, who notes a few problems with Will’s credibility:

The executive editor of the Washington Post was formally with the WSJ, and perhaps that explains some, but not much of this embarrassment.  But no, there can be only one explanation:  these people are not mentally healthy individuals—they are incapable of processing reality.  And given what’s at stake, the word sociopath seems more and more appropriate.

Thankfully, much of the world has better grip on reality, and this Guardian editorial—printed in 56 newspapers, 45 countries, and 20 languages—says it well.

The Battle Over Energy Code


[ How many of those new Bellevue buildings would be using less energy if we had stricter State energy code? ]

The construction industry and the automobile manufacturers must be cut from the same cloth. Because when confronted with the critically important task of increasing the energy efficiency of their products, instead of providing bold leadership and innovation, all they both seem to do is whine and complain that it’s too hard.

On November 20 the Washington State Building Code Council approved updates to the State’s energy code, dragging along the status-quo construction industry kicking and screaming. Governor Chris Gregoire had called for the updates to require a 30 percent improvement in energy efficiency over current code, but pressure from construction industry lobbyists succeeded in watering that down to a range between 15 and 18 percent.

In a November 25 press release, State Rep. Dan Kristiansen (R-Snohomish) claimed that the code updates will add up to 20 percent to the cost of new homes, citing an industry study that estimated a $24,000 premium on a 1200 square-foot, single-story home. Scared yet? But oops, apparently someone didn’t get the memo:  the press release also claims—incorrectly—that the new code will “require a 30 percent reduction in energy consumption for buildings by July 2010.”

Unsurprisingly, the Master Builders Association also pushed back hard, and write on their web site:

The SBCC’s vote will increase the cost of housing by $5,000 to $10,000 per single-family home, beginning on July 1, 2010. The original figure of more than $10,000 per home was reduced as a result of our association’s efforts to expose the damaging effect such changes would have on the industry.

That still might sound like a lot, so then how about a third opinion, this one from the Washington State Department of Commerce:

Improved technology, air sealing, testing and labeling will add about $1 per square foot to a new house. The owner of a 2,000-square-foot house will earn that back in energy-bill savings in a year or less, pocketing the annual savings every year there after.

Perhaps not so scary after all. Smart even. Perhaps?

The other main industry objection is about jobs, that the burst bubble has already obliterated construction, and now is not the right time to make significant changes. As Kristiensen put it, “This will serve to do nothing more than prolong an already serious recession.” But those who make this argument are conveniently forgetting about all the jobs that will be created by the demand for new products and services associated with energy-efficient construction, a.k.a. green jobs.

And besides, it’s never the right time.  If code changes were proposed during a boom no doubt the argument would morph into how we can’t introduce any extra cost when home buyers are already being stretched to their limits by rising prices.

All that said, there’s some great stuff in the new energy code, which becomes effective in July 2010:

Among the residential code improvements passed by the Council are:

  • Programmable thermostats on all primary heating systems
  • Air leakage testing with a “blower door” for all new homes
  • Duct testing for all new heating, ventilation and air-conditioning systems
  • Posting of a certificate of residential energy efficiency features on new homes

Commercial improvements include:

  • Upgrades to lighting controls, including occupancy sensors and technology to take better advantage of daylight
  • Upgraded insulation for ceilings
  • More energy efficient windows
  • Sub-metering for tenants to help them manage energy use

Though none of this is rocket science.  And I can’t help editorializing that it’s about effin time.

Because in the U.S, buildings consume between about 40 to 50 percent of total energy (depending on how the beans are counted), and account for 43 percent of total greenhouse gas emissions.  And because once a building is on the ground, it’s likely to stay around for 50 to 100 years—and that’s a long time to live with a missed opportunity.

I wanted to wrap this one up with a quip about how we can hope the construction industry learns a lesson from the fate of auto industry, but unfortunately it’s still not clear whether or not U.S. automakers have learned anything.

Climate Change Mitigation Is A Win-Win-Win-etc.

Assessments of mitigation strategies in four domains—household energy, transport, food and agriculture, and electricity generation—suggest an important message: that actions to reduce greenhouse-gas emissions often, although not always, entail net benefits for health. In some cases, the potential benefits seem to be substantial. This evidence provides an additional and immediate rationale for reductions in greenhouse-gas emissions beyond that of climate change mitigation alone.

So says a summary of  a new series of reports on climate change mitigation and public health, recently published in the Lancet (full article here).  Yet another example of what’s good for the planet is good for people.  No coincidence, that.

Meanwhile the call to make Seattle a carbon-neutral city by 2030 continues to reverberate. And one of the main conclusions in the Lancet series that’s most relevant to Seattle is this:

In terms of strategic choices, the greatest health gains seem likely to result from changes towards active transport, and from diets that are low in animal source foods, at least for adult populations in high-income countries.

Regarding animal source foods, the persistence of meat-based diets in educated and progressive cities like Seattle is a remarkable example of the power of culture. Most of us know that eating less meat makes both us and the planet healthier, and that meat production is a major source of greenhouse gas emissions. Yet relatively few of us take that information seriously enough to make meaningful changes to our lifestyles.

The term “active transport” is code for walking and biking. Copenhagenize has a good post on the transport piece of the Lancet series, writing:

The report suggests that funds be redirected away from roads in order to make walking and cycling “the most direct, convenient and pleasant options for most urban trips”. Pedestrians and cyclists should also benefit from having a “priority” over cars and trucks at intersections.

And also noting the key point that:

Walking and cycling came out on top even when compared to increased use of low-emission vehicles that are widely sold as “green” solutions.

Because our transportation choices are so dependent on land use patterns, change on this front is a task far more challenging than eating less meat. Nevertheless it is a path that we should pursue, because (1) we need to be working on many strategies in parallel if we hope to avoid catastrophic climate change, and (2)  because the potential benefits extend beyond climate change mitigation and health.

We already have a proven model for restructuring our built environment to promote active transport:  transit-oriented communities (TOC). Futurewise, GGLO, and Transportation Choices Coalition recently published a report on TOC in the context of Seattle and Washington State, summarizing that high-performing TOC have the potential to:

  • Promote health by encouraging walking and bicycling, cutting air pollution, and reducing motor vehicle accidents;
  • Lower household expenses for both transportation and housing;
  • Reduce municipal infrastructure costs;
  • Provide a high return on public investment in transit infrastructure;
  • Help meet the growing demand for walkable neighborhoods;
  • Curb land consumption and thereby help conserve working farms and forests, and protect natural ecosystems and water quality; and
  • Cut energy consumption and greenhouse gas emissions associated with both transportation and the built environment.

We also know that climate change mitigation has the potential to be an economic win: carbon-free prosperity is possible. And we also know that the cost of doing nothing is likely orders of magnitude higher than the cost of mitigation, and will be disproportionally felt by the poor.

How many vital reasons will we need before we get serious?

>>>


[ Confused about what this graph from the Lancet summary report is trying to tell us?  You’re not alone—it’s a great example of bad visual communication.  My take on it, without bothering to read the details, is that “active transport” and “lower carbon driving” have about the same potential for GHG reductions, but you get more health benefits from active transport.  Not surprising.  But also: the potential benefits from cleaner electricity generation dwarf transport, even in the EU. ]